File:Movingtarget.png
Movingtarget.png (640 × 480 pixels, file size: 50 KB, MIME type: image/png)
The maths
Note: if you think this is wrong, please fix it and then redo the plot… Or at least speak up.
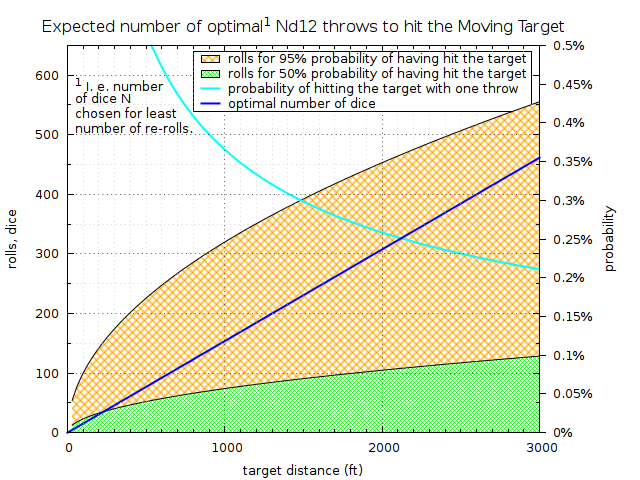
The mean value of a twelve-sided die (d12) is
- µ1=(1+…+12)/12=6.5.
Its variance is
- σ1²=((1-µ1)²+…+(12-µ1)²)/12=143/12≈11.9.
Let t be the target distance. The optimum number of dice is
- n=t/µ1.
Per the central limit theorem, the result of rolling nd12 and dividing by n, for large n, is almost normally distributed with mean
- µ=µ1
and variance
- σ²=σ1²/n.
We are interested in the probability of rolling nd12 and getting a value between t-1/2 and t+1/2, i. e. getting a value between µ-1/2n and µ+1/2n from this distribution.
The cumulative distribution function of the normal distribution is
and the probability which we seek is
- P(n)=cdf(µ+1/2n)-cdf(µ-1/2n)
- =(erf(1/(2nsqrt(2σ²)))-erf(-1/(2nsqrt(2σ²))))/2
- =erf(1/(2nsqrt(2σ²)))
- =erf(1/sqrt(286n/3))
- =erf(sqrt(3/286n)).
After rolling nd12 k times, the probability of never having hit t is (approximately) (1-P(n))k, so we will have hit t with probability p after
- E(p,n)=log1-P(n)(1-p)=log(1-p)/log(1-P(n))
nd12 rolls.
Code
gnuplot code to generate this image:
set terminal pngcairo size 640,480 enhanced font ",10"
set output "movingtarget.png"
set title "Expected number of optimal^1 Nd12 throws to hit the Moving Target" \
        font ",12"
set xlabel "target distance (ft)"
set ylabel "rolls, dice"
set y2label "probability"
set xtics 1000
set mxtics 10
set ytics 100
set mytics 2
set yrange [0:650]
set y2tics out 0, 0.05
set y2range [0:0.5]
set format y2 "%.2g%%"
set grid xtics mxtics ytics mytics front lc rgb "black", lc rgb "grey"
set key top right Left reverse box width -12 samplen 1.5
set style fill border lc rgb "black" pattern 1

P(n)=erf(sqrt(3/(286*n)))
E(p,n)=log(1-p)/log(1-P(n))
D(t)=t/6.5

set label at 50, 586 front \
        "{}^1 I. e. number\nof dice N\nchosen for least\nnumber of re-rolls."
plot [t=0:3000] E(0.95,D(t)) lt rgb "orange" with filledcurves x1 \
                title "rolls for 95% probability of having hit the target", \
                E(0.50,D(t)) lt rgb "green" with filledcurves x1 \
                title "rolls for 50% probability of having hit the target", \
                100*P(t) axes x2y2 lt rgb "cyan" lw 2 \
                title "probability of hitting the target with one throw", \
                D(t) lt rgb "blue" lw 2 \
                title "optimal number of dice"
File history
Click on a date/time to view the file as it appeared at that time.
| Date/Time | Thumbnail | Dimensions | User | Comment | |
|---|---|---|---|---|---|
| current | 01:53, 4 September 2025 | | 640 × 480 (50 KB) | Maintenance script (talk | contribs) | == Summary == Importing file |
You cannot overwrite this file.
File usage
The following page uses this file:

